Burkey Capital LLC
John Burkey
President
BurkeyLoan®
January 29, 2026
Why Affordable Home Policy Is Being Ignored – The Real Excuse & Final Solution
Policymakers are overstating a weak risk — “protecting senior home equity” — while ignoring the real systemic risk: an impending commercial real estate refinancing shock.
The result is paralysis on housing affordability policy, misattributed blame to the Federal Reserve, and a missed opportunity to deploy counter-cyclical housing supply that would stabilize — not destabilize—the broader economy.
The “Senior Equity Risk” Argument Is Weak and Overapplied
Policymakers frequently argue that expanding housing supply risks undermining senior citizens’ home equity, particularly retirees relying on housing wealth.
But the data does not support this fear at a macro level:
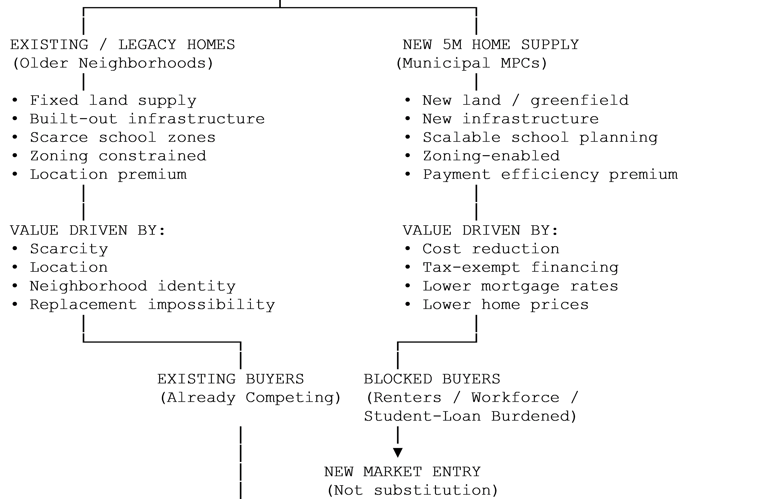
Senior and near-retirement buyers account for ~20–40% of annual homebuyers, yet their transactions touch only ~1.5–2.5% of total housing stock per year.
Home prices in established neighborhoods are driven by scarcity, zoning, school districts, and location, not by marginal greenfield supply.
Historical evidence shows that new supply built outside legacy neighborhoods slows price growth volatility but does not cause price collapse.
In short:
The risk to senior home equity from targeted new housing supply is marginal, localized, and largely theoretical.
The Real Systemic Risk Is CRE Refinancing — Not Housing Supply
While policymakers debate hypothetical residential price impacts, the commercial real estate market faces a quantifiable, near-term refinancing shock:
$1.9 trillion in CRE debt matures in 2025–2026 alone, 2027 could push it over $2T.
A +200 bps rate reset implies ~$60+ billion per year in additional fixed debt service across office, multifamily, healthcare, and hospitality.
Office assets are already in severe stress due to NOI erosion, and multifamily faces the largest absolute dollar exposure.
This is not a price problem. It is a payment and refinancing problem — the same dynamic facing households, but at institutional scale. Is the $200B at FF a bailout fund?
Policy Failure Is Being Misattributed to the Federal Reserve
Instead of confronting the CRE refinancing wall directly, policymakers increasingly blame inaction on the Fed’s reluctance to rapidly cut rates.
This framing is flawed:
Rate cuts alone cannot repair impaired NOI, broken office demand, or over-leveraged capital stacks.
Even aggressive cuts would not restore 2020–2021 underwriting assumptions.
Waiting for the Fed delays action while refinancing stress compounds.
This mirrors past policy errors: outsourcing structural problems to monetary policy rather than addressing them with targeted fiscal and financing tools. Remember 2008 residential problem: mortgages adjusted up, refi comps didn’t hold and the whole thing snowballed
The 5-Million-Home Initiative Is Counter-Cyclical Protection — Not a Threat
The 5-Million-Home Initiative directly addresses this policy gap:
Why it is counter-cyclical:
It adds residential supply when private capital is constrained.
It stabilizes construction employment during CRE contraction.
It supports household formation, preventing spillovers from CRE stress into residential demand.
Why it does not harm existing homeowners:
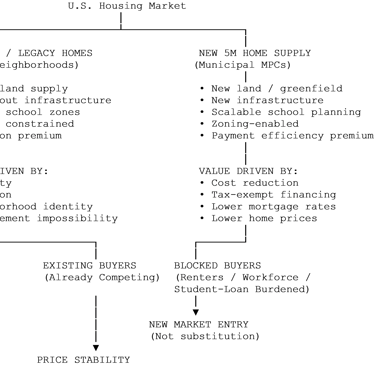
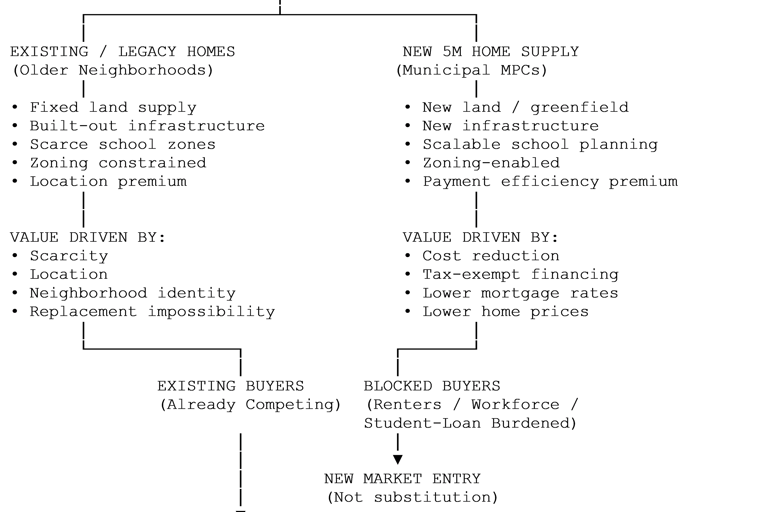
It targets new communities near metro job growth, not legacy neighborhoods.
It serves blocked buyers — renters priced out by payment friction — not speculative demand.
It preserves the scarcity premium of established housing stock.
Municipal Financing Changes the Rate Equation Entirely
Critically, the initiative does not rely on Fed Reserve rate cuts:
Municipal tax-exempt financing lowers effective borrowing costs independent of Treasury/Fed policy.
Infrastructure costs are reduced upfront, lowering required home prices.
Mortgage payments fall even if nominal rates remain elevated.
This means the program can:
Create its own rate environment, insulating housing affordability from both CRE stress and monetary policy delays.
Conclusion
Policymakers are anchoring housing affordability paralysis to a misstated risk of senior equity erosion, while the true macro threat lies in a looming CRE refinancing cycle that rate cuts alone cannot fix. The 5-Million-Home Initiative offers counter-cyclical protection by expanding residential supply through municipally financed payment-efficient development that stabilizes households, employment, and communities — without undermining existing home values. Failing to act does not protect seniors; it merely allows commercial refinancing stress to metastasize into a broader economic drag.
US Housing Market
Economic Segmentation Diagram
A National Housing, Workforce, and Economic Growth Strategy
Executive Summary
The United States faces a structural housing shortage that is constraining affordability, limiting labor mobility, and slowing economic growth. The 5-Million-Home Initiative is a coordinated, multi-year public-private strategy to deliver five million attainable single-family homes across approximately 70 large-scale, master-planned developments, aligned with infrastructure expansion and employment growth. The initiative is designed to restore housing affordability, expand the construction and infrastructure workforce, improve employer access to labor, and generate durable fiscal benefits for federal, state, and local governments.
1. Affordability: Payment-Based Housing at National Scale
Housing affordability is fundamentally a monthly payment problem, not a price problem.
The initiative:
Delivers new, entry-level and move-up single-family supply
Aligns financing to payment stability, not speculative pricing
Reduces pressure on rents by expanding ownership pathways
Lowers per-unit costs through scale, standardized infrastructure, and coordinated land development
Outcome: Millions of households gain access to stable housing payments, reducing cost-of-living pressure without inflationary subsidies.
2. Employment Growth: A National Jobs Engine
The initiative functions as a distributed infrastructure and construction program, creating sustained employment over a decade.
Estimated impacts:
Large-scale demand for construction trades, infrastructure workers, engineers, planners, and suppliers
Stable, multi-year project pipelines that support workforce training and apprenticeship programs
Revitalization of small and mid-size builders through predictable demand and reduced regulatory friction
Outcome: Millions of job-years created across construction, materials, logistics, professional services, and local businesses.
3. Workforce Access: Housing as Economic Infrastructure
Housing is labor infrastructure. When workers cannot afford to live near jobs, productivity and growth suffer.
The initiative:
Locates new housing near employment corridors, logistics hubs, and emerging industry clusters
Expands labor pools for manufacturing, technology, health care, energy, and public services
Reduces commute times, turnover, and wage pressure driven by housing scarcity
Outcome: Employers gain access to a broader, more stable workforce, accelerating regional economic development.
4. Fiscal Benefits: Positive Returns for All Levels of Government
Unlike demand-side subsidies, large-scale supply expansion produces compounding fiscal benefits.
Federal
Higher employment and wages → increased income and payroll tax receipts
Reduced pressure on housing-related assistance programs
Stronger macroeconomic growth and productivity
State
Expanded tax base from new households and economic activity
Lower social service strain from housing instability
Improved competitiveness in attracting employers
Local
New property, sales, and utility tax revenues
Infrastructure cost sharing through master-planned development
Long-term community stability and growth
Outcome: The initiative strengthens public balance sheets rather than burdening them.
5. Strategic Conclusion
The 5-Million-Home Initiative treats housing as core economic infrastructure, not a speculative asset class. By aligning supply, labor, and capital at national scale, it simultaneously addresses affordability, job creation, workforce access, and fiscal sustainability.
Stable housing enables stable labor. Stable labor enables growth. Growth strengthens public finances.
Bottom-Line Message
“The 5-Million-Home Initiative is a supply-driven strategy that restores housing affordability, creates millions of jobs, expands workforce access for American industry, and delivers durable economic and fiscal benefits to federal, state, and local governments—without relying on inflationary demand subsidies.”
___________________________________________________
The 5-Million-Home Initiative - Quantified Ranges
FYI: method (transparent): I’m using NAHB’s National Impact of Home Building summary metrics (jobs and government revenue per average single-family home) and NAHB’s “Typical Local Area” impact model (local income/jobs/taxes during construction and ongoing annual impacts once homes are occupied). Because actual impacts vary by home value, local tax rates, wage rates, and build costs, I’m presenting ranges around the NAHB “average” case.
[supports online presentation at BurkeyCapital.com]
1) Jobs supported (construction-phase “job-years”)
NAHB national metric: Building an average single-family home generates ~2.90 full-time-equivalent jobs (job-years).
5,000,000 homes ⇒ ~14.5 million job-years (central estimate).
Range: ~12 to 17 million job-years (± ~15–20% for regional cost/wage mixes, supply chain intensity, and productivity).
What this means: a decade-scale pipeline can support a sustained national workforce buildout across trades + manufacturing + logistics + professional services (engineering, finance, real estate, legal).
2) Government revenue (federal + state/local)
NAHB national metric: per average single-family home, ~$129,647 total government revenue (~$86,759 federal taxes + ~$42,888 state/local fees & taxes).
5,000,000 homes ⇒ ~$648 billion total government revenue (central estimate).
Range: ~$500B to $800B (variation driven by home values, impact fees, property tax regimes, and income/payroll tax bases).
3) GDP proxy (income/value-added impact during buildout)
NAHB’s local impact model reports local income generated during the construction year.
Typical-local-area metric: Building 100 single-family homes produces ~$28.7M in local income in the construction year.
That implies ~$287K income per home as a local income proxy (wages + business income) during the build year.
5,000,000 homes ⇒ ~$1.44 trillion in income/value-added proxy during the construction years (central estimate).
Range: ~$1.1T to $1.8T (depends on build cost, local wage rates, and how much of the supply chain is domestic/local).
Note: Presented as a GDP/value-added proxy (income generated), not a precise national GDP accounting estimate.
4) Ongoing annual economic base after occupancy (recurring)
NAHB’s local model also estimates recurring annual impacts once homes are occupied.
Typical-local-area metric (annual, recurring) for 100 SF homes:
~$4.1M local income
~$1.0M local taxes/other revenue
~69 local jobs (FTE)
Scaled to 5,000,000 homes (central estimates):
Ongoing annual local income proxy: ~$205B/year
Ongoing annual local revenue: ~$50B/year
Ongoing annual jobs supported: ~3.45M jobs (FTE)
Range (recommended to cite publicly):
~$150B to $260B/year ongoing income proxy
~$35B to $65B/year ongoing local revenue
~2.5M to 4.0M ongoing jobs supported
Summary
“Using NAHB’s impact models, a 5-million-home national buildout supports roughly 12–17 million job-years, generates roughly $500–$800B in combined federal/state/local revenues, and produces an estimated $1.1–$1.8T income/value-added proxy during construction—followed by $150–$260B/year in ongoing local income and $35–$65B/year in recurring local revenues once homes are occupied.”
THE 5 MILLION HOME INITIATIVE
10-YEAR FISCAL IMPACT MODEL
Using Municipal Mortgage Classification + Public Land Partnerships + BurkeyLoan® for Master Planned Communities
Summary
A national strategy to build 5,000,000 new homes in 10 years using municipal mortgage classification, public-land partnerships, and BurkeyLoan® generates:
Federal Fiscal Impact (10 years)
$910B to $1.22T in new federal tax revenue
2.8M to 3.4M new jobs
$5.8T to $7.1T cumulative GDP impact
State Local Fiscal Impact (10 years)
$1.35T to $1.72T in combined new tax revenue
$350B to 450B total infrastructure cost offset through land-value capture
States break even in 1.5–3.5 years per MPC
Total Government Revenue Surplus
-----à $2.26T to $2.95T net gain across all levels of government.
1. MPC Framework Used in This Model
Scale Increase
Earlier plan: 25–35 MPCs
New plan: 50–70 MPCs active concurrently
Site Size
50,000–100,000 residents per site
25,000–50,000 housing units per site
2,500–4,500 homes/year absorption per site
(achievable due to 4.0% → 3.5% effective mortgage environment)
National Production Goal
5 million homes in 10 years
Average: 500,000 homes/year
2. Fiscal Impact Drivers
The 10-year fiscal model for states and the federal government is driven by four economic mechanisms:
(1) Municipal Mortgage Classification
Mortgage interest becomes federal & state tax-exempt
Investors accept 30% lower yields
Effective rate drops to 3.5%–4.0%
Buyer pool expands 40–55%
Doubles absorption relative to normal rate cycles
(2) Government-Contributed Land & Infrastructure
Removes $50k–$100k from foundation cost of each home
Public land enables 35% land-value capture on commercial/tech acreage
States earn back investment in 1.5–3.5 years
(3) BurkeyLoan® Mortgage
Rolls student/consumer debt into the mortgage
Eliminates PMI via tranche structuring
Improves DTI by 1.5–3.5 points
Expands purchase eligibility by 10–15%
Reduces delinquency risk (behavioral credit modeling)
(4) Large-Scale Economic Expansion
Each MPC becomes a regional employment hub
Create commercial activity, payroll, population growth
Drives long-term tax base expansion
3. Federal Fiscal Impact Model (10 Years)
A. New Federal Income Tax Revenue
5M households × avg $75k income = $375B annual taxable base
At ~12–15% federal effective rate = $45–56B/year
10-year federal income tax gain: $450B–$560B
B. Payroll & Corporate Tax Expansion
New employment: 2.8M–3.4M
Average payroll tax: $4,600 per worker per year
→ $12.9B–$15.6B/year
Corporate expansion adds: $8–11B/year
10-year total payroll/corporate tax: $210B–$265B
C. Indirect Federal Tax Benefit (GDP Multiplier)
Every new home historically generates ~$180k–$240k GDP over 10 years
→ 5M homes = $900B–$1.2T GDP per year
Federal taxation on this activity at 10% effective rate:
$90–$120B/year → $900B–$1.2T over 10 years
Total Federal Fiscal Impact: +$910B to +$1.22T
4. State + Local Fiscal Impact Model (10 Years)
A. Property Tax Base Expansion
5M homes × average assessment $300k × 1.0% rate
→ $15B/year
10-year total: $150B
B. Sales Tax Impact
5M new households generate ~$22k household consumption per year
Taxable at 4.5–7% = $4.95B–$7.7B/year
10-year total: $49.5B–$77B
C. State Income Tax
62% of Americans live in income-tax states
Avg rate ~4.5%
Tax base impacted:
5M households × $75k = $375B × 62%
Income taxable: $232B
State revenue: $10.5B/year
10-year total: $105B
D. Commercial/Tech Land Revenue Participation (35%)
Estimated commercial + tech land value across 70 MPCs: $1.5T–$2.1T
Government 35% share: $525B–$735B over 10 years
This alone nearly offsets infrastructure costs.
E. State GDP Growth
5M new homes create long-term:
More workforce
Faster business formation
Increased migration inflow
GDP uplift: $2.1T–$3.0T over 10 years
State/local taxes at 6–7% blend → $126–$210B
Total State + Local Fiscal Impact:
$1.35T to $1.72T (10 years)
5. Government Break-Even Timeline
State/Local Break-Even
Infrastructure & land contribution: ~$400B–$500B total
Land-value capture: $525B–$735B
Additional yearly taxes accelerate break-even
State/local break-even: 1.5–3.5 years per MPC
Federal Break-Even
Federal reinvestments are minimal—classification, regulatory relief, and small grant match.
Federal break-even occurs immediately via year-1 new tax revenue (~$90–$135B).
6. Total Government Fiscal Surplus (10 Years)
Level
Surplus
Federal
+$910B to +$1.22T
State + Local
+$1.35T to +$1.72T
Total
+$2.26T to +$2.95T
This makes the 5M-home initiative one of the most fiscally positive national economic programs in U.S. history—without requiring federal appropriations.
Below is a strategic national deployment map for 70 MPC sites, optimized to deliver 5 million new homes in 10 years using:
Municipal mortgage classification (30% effective rate reduction)
Government-contributed land & infrastructure
BurkeyLoan® mortgage integration
High absorption (2,500–4,500 homes/year per site)
Regional labor + materials capacity
Employer base and economic development alignment
This is formatted for leadership briefings, state/federal planning, and investor presentations.
NATIONAL MPC DEPLOYMENT MAP — 70 SITES
Target: 5-Million New Homes in 10 Years
The U.S. is divided into 7 Regional Housing Zones, each receiving 10 MPCs of 50,000–75,000 homes each.
REGION 1 — Southeast (10 MPC Sites)
States: FL, GA, NC, SC, AL, TN
Rationale: Fastest population growth, pro-housing policy, land availability.
Recommended Locations (10):
Jacksonville–St. Augustine, FL
Tampa–Lakeland Corridor, FL
Orlando North, FL
Atlanta South, GA
Savannah–Pooler, GA
Raleigh Outer Belt, NC
Charlotte East, NC
Nashville East, TN
Huntsville North, AL
Greenville–Spartanburg, SC
Projected output: 900,000+ homes
REGION 2 — Texas Power Region (10 MPC Sites)
States: TX only
Rationale: Most pro-development market in the U.S. with the largest land capacity.
Recommended Locations (10):
Austin East Tech Corridor
San Antonio–New Braunfels
Houston North (Conroe–Huntsville)
Houston West (Katy extension)
Dallas North (Celina–Prosper)
Dallas South (Waxahachie region)
Fort Worth West (Weatherford)
Waco Region
Corpus Christi Outer Belt
Rio Grande Valley Growth Zone
Projected output: 950,000–1.1M homes
REGION 3 — Mountain West (10 MPC Sites)
States: AZ, NV, CO, UT, ID
Rationale: Strong employer migration + abundant buildable land.
Recommended Locations (10):
Phoenix West Valley
Phoenix Casa Grande Corridor
Tucson Outer Ring
Las Vegas North
Reno–Sparks East
Salt Lake City South
Provo–Spanish Fork
Denver North (Erie–Firestone)
Colorado Springs East
Boise Southwest
Projected output: 700,000–800,000 homes
REGION 4 — Midwest Growth Belt (10 MPC Sites)
States: OH, MI, IN, WI, MO, KS
Rationale: Undervalued land + need for revitalization + strong labor supply.
Recommended Locations (10):
Columbus East, OH
Tampa–Lakeland Corridor, FL
Detroit Suburban Ring, MI
Grand Rapids, MI
Indianapolis Outer Belt, IN
Louisville–Southern Indiana
St. Louis West, MO
Kansas City North, MO
Wichita Surrounding Area, KS
Madison–Rockford Corridor
Projected output: 500,000–650,000 homes
REGION 5 — Northeast Corridor (10 MPC Sites)
States: PA, NY, NJ, MD, VA
Rationale: High housing demand + limited supply; many redevelopment zones suitable for MPCs.
Recommended Locations (10):
Harrisburg Region, PA
Allentown–Bethlehem, PA
Scranton–Wilkes-Barre, PA
Richmond South, VA
Virginia Beach West, VA
Rochester Suburban Ring, NY
Buffalo South, NY
Southern New Jersey (Inland Pine Belt)
Baltimore Surrounding Belt, MD
Fredericksburg–Stafford VA Corridor
Projected output: 450,000–550,000 homes
REGION 6 — Pacific Growth Region (10 MPC Sites)
States: CA, OR, WA
Rationale: Housing shortage + economic strength.
(Note: Sites must be selected inland, allowing municipal mortgage zones to lower effective rates even in high-cost markets.)
Recommended Locations (10):
Sacramento North
Sacramento South (Elk Grove)
Central Valley (Modesto–Turlock Region)
Fresno–Clovis East
Bakersfield North
Inland Empire Expansion (Victor Valley)
Vancouver Suburban Ring, WA
Tri-Cities, WA
Salem–Keizer, OR
Eugene–Springfield Outer Belt
Projected output: 500,000–600,000 homes
REGION 7 — Gulf & Central South (10 MPC Sites)
States: LA, MS, AR, OK, KY
Rationale: Lowest-cost land + strategically placed for climate migration.
Recommended Locations (10):
Baton Rouge North, LA
Lafayette Outer Region, LA
Jackson Suburban Ring, MS
Gulfport–Biloxi Expansion, MS
Little Rock West, AR
Northwest Arkansas (Bentonville–Rogers)
Tulsa Suburban West, OK
Oklahoma City North, OK
Bowling Green, KY
Lexington Southeast, KY
Projected output: 400,000–525,000 homes
NATIONAL TOTAL (70 SITES)
Projected 10-Year Output:
5,050,000 – 5,400,000 new homes
Effective Rates:
Municipal mortgage classification → 3.5%–4.0% effective rates
(underlying 6–6.25% market rates)
Absorption Speed:
2,500–4,500 homes/year per MPC
(dependent on region + labor availability)